Plot points on an image or diagram. The image must be accessible via a URL, and the data must contain two columns for X and Y coordinates.
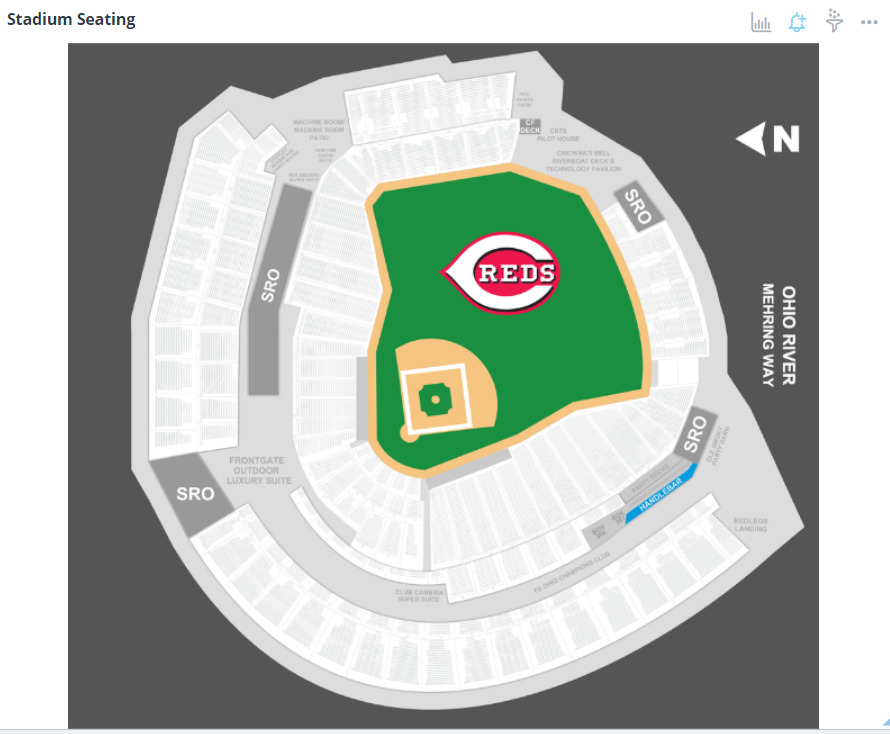
Chart Configuration
| Field |
Interpretation |
| Image URL |
Add image URL |
| X coordinate |
Represents X coordinate |
| Y coordinate |
Represents Y coordinate |
| Point Size |
Defaults to 1 |
| Point Color |
Defaults to red |
| Bottom Left Zero Position |
Defaults to the top left |
| Scale Coordinates |
It can be integer or decimal |
| Group By |
Select a field to group points by |
| Hover Fields |
Fields to show when hovering on points |
| Field |
Interpretation |
| Title Font Color |
Set the title font color of the widget |
| Title Font Size |
The default title font size is 14px. |
| Field |
Interpretation |
| Show Title |
Show Title on Widget |
| Analyze |
Show Analyze menu |
| Alerts |
Show Alert icon |
| Filters |
Show Filter icon |
| Drilldowns |
Show Drilldowns menu |
| Query |
Show Query menu |
| Data/Export |
Show Data/Export menu |
| Data Diagram |
Show Data Diagram |
| Share |
Show Share menu |
| Refresh |
Show Refresh menu |
| Maximize |
Show Maximize menu |
| Remove from Dashboard |
Show Remove from the Dashboard menu |