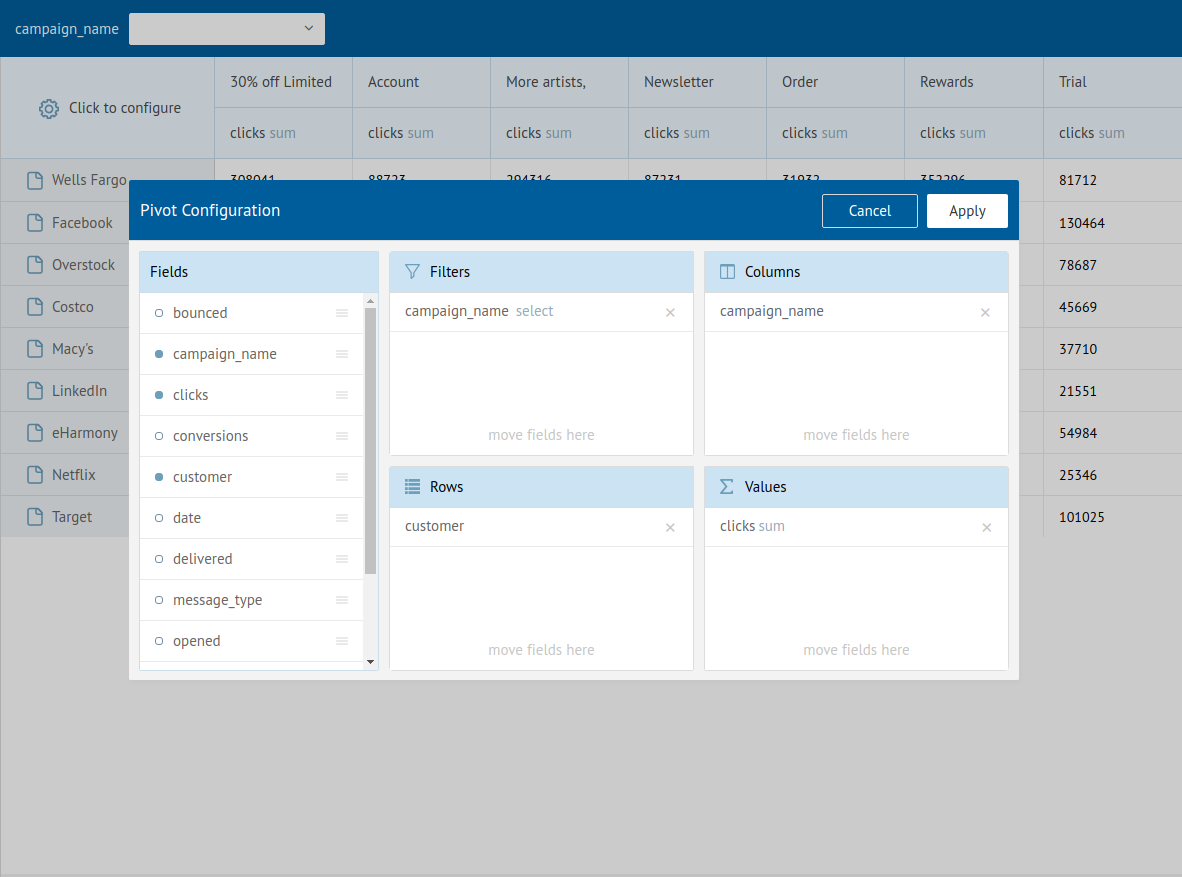
A Pivot table is used to organize, summarize, and compare complex data. It allows you to extract significance from a large data set.
There are 7 operations available: sum, count, max, min, ratio, avg, tally. Setting your column operation to ratio will compute the correlation between the previous two columns to the left. Tally displays subtotal and grand total cells as count while displaying all regular cells as sum.
| Field |
Interpretation |
| Title Font Color |
Set the title font color of the widget |
| Title Font Size |
The default title font size is 14px. |
| Data Format |
Formatting for one or more fields |
| Fit To Widget Width |
To make columns shrink to fit widget width to eliminate horizontal scroll |
| Footer Font Size |
To set the font size of the footer |
| Footer Row Height |
To set the row height of the footer |
| Text Wrap |
Allow cell text to break on multiple lines |
| Single Row Representation |
collapse all nested rows to a single row |
Column and Header Settings
| Field |
Interpretation |
| Header Background Color |
Set the header background color; default to dark blue |
| Header Font Color |
Set the header font color; default to black |
| Header Font Size |
Set the header font size |
| Header Height |
To adjust the height of the header |
| Minimum Column Width |
To set the minimum grid width |
| Column Sort Order |
Sorting order of column headers. By default, the sorting order of the rows follows the order in the dataset. |
| Hide Last Header Row |
To hide the last header row |
| Total Column |
An Additional column with summary for each row |
Row Settings
| Field |
Interpretation |
| Rows Font Color |
Set the font color of rows |
| Rows Font Size |
Set the font size of rows |
| Rows Background Color |
Default to white |
| Total Row |
Footer row with summary for each column |
| Auto Collapse Rows |
Shows all rows initially collapsed |
| Row Height |
The height of each row in the grid |
| Field |
Interpretation |
| Show Title |
Show Title on Widget |
| Analyze |
Show Analyze menu |
| Alerts |
Show Alert icon |
| Filters |
Show Filter icon |
| Drilldowns |
Show Drilldowns menu |
| Query |
Show Query menu |
| Data/Export |
Show Data/Export menu |
| Data Diagram |
Show Data Diagram |
| Share |
Show Share menu |
| Refresh |
Show Refresh menu |
| Maximize |
Show Maximize menu |
| Remove from Dashboard |
Show Remove from the Dashboard menu |
Advanced Configuration
| Field |
Interpretation |
| Enable Pivot Configuration |
Displays the configure button for pivot tables for non-viewer roles |
| Reset Pivot Structure |
Clear all rows, columns, values, and filters |