A chord diagram is a graphical method of displaying the inter-relationships between data in a matrix.
The data is arranged radially around a circle, with the relationships between the points drawn as arcs connecting the data together.
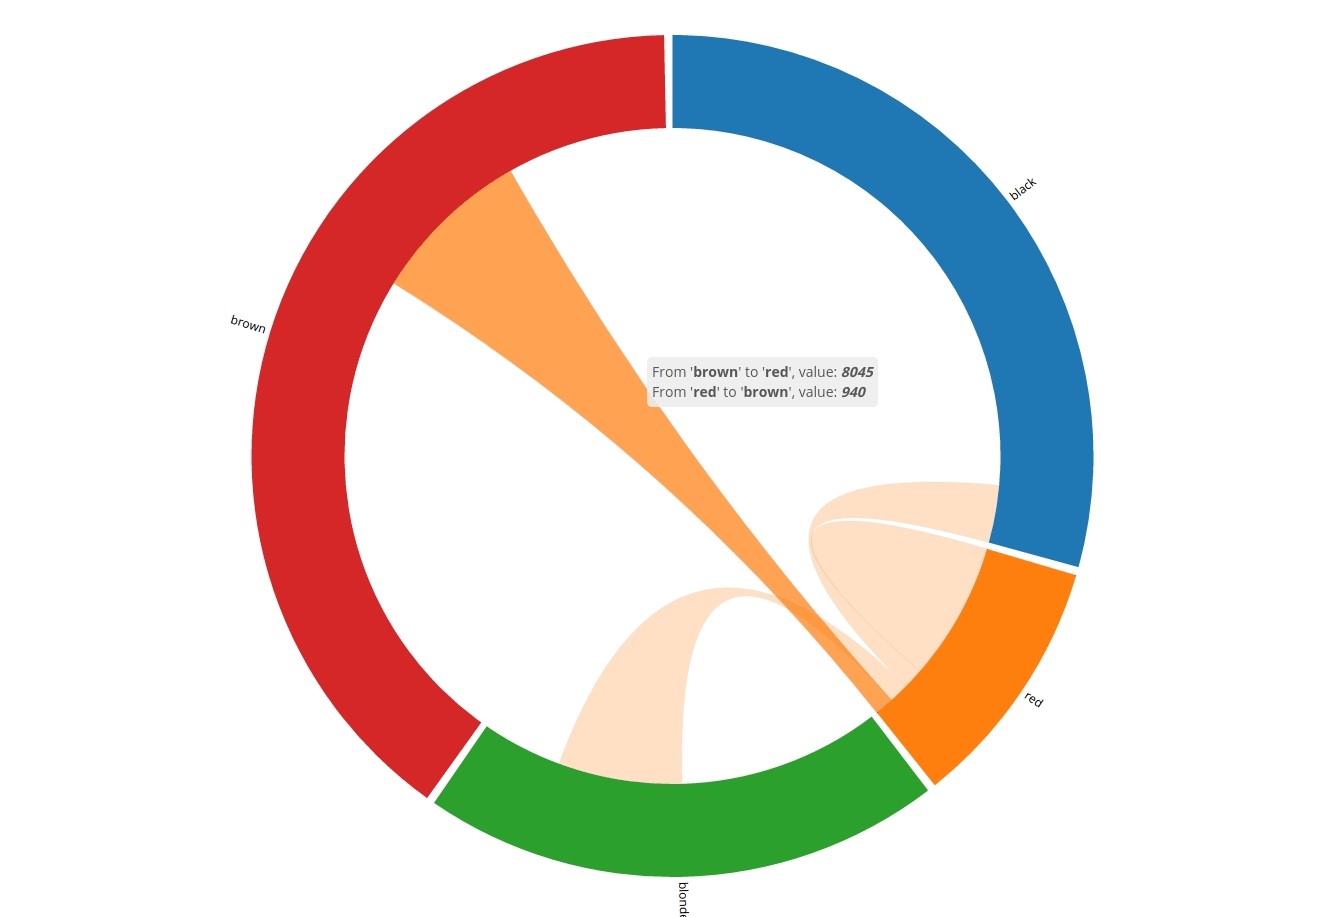
Chart Configuration
| Field |
Interpretation |
| From |
Choose the field that represents from |
| To |
Choose the field that represents to |
| Counts/Values |
Choose the field that represents the counts |
| Field |
Interpretation |
| Title Font Color |
Set the title font color of the widget |
| Title Font Size |
The default title font size is 14px. |
| Field |
Interpretation |
| Show Title |
Show Title on Widget |
| Analyze |
Show Analyze menu |
| Alerts |
Show Alert icon |
| Filters |
Show Filter icon |
| Drilldowns |
Show Drilldowns menu |
| Query |
Show Query menu |
| Data/Export |
Show Data/Export menu |
| Data Diagram |
Show Data Diagram |
| Share |
Show Share menu |
| Refresh |
Show Refresh menu |
| Maximize |
Show Maximize menu |
| Remove from Dashboard |
Show Remove from the Dashboard menu |