Variant of Gauge - Speedometer chart in Speedometer form.
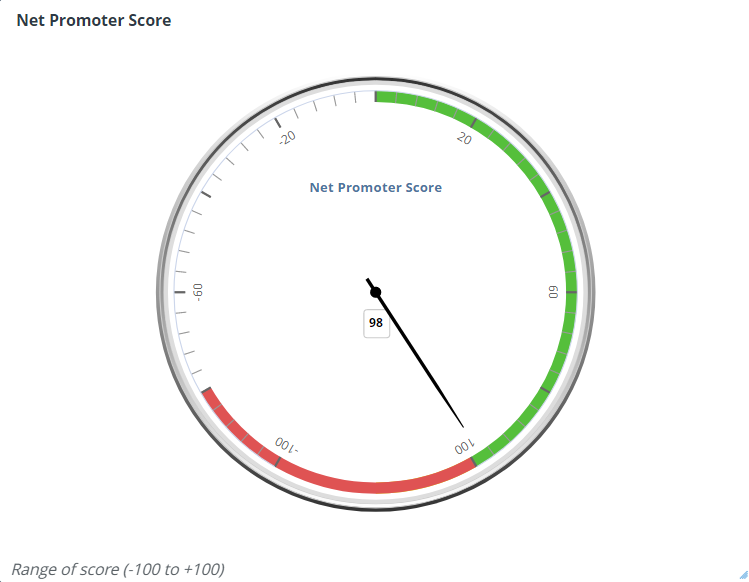
Chart Configuration
| Field |
Interpretation |
| Plot Data/Y-Axis |
Numeric Y-axis field to use. Leave it empty if for multiple Y-axis fields. |
| Max Value |
Goal value |
| Min Value |
Start value |
| First Range Value |
The numeric stop value for the first range |
| Second Range Value |
Numeric stop value for the second range |
| Third Range Value |
Numeric stop value for the last range |
| First Range Color |
Color stop value for the first range |
| Second Range Color |
Color stop value for the second range |
| Third Range Color |
Color stop value for the third range |
| Field |
Interpretation |
| Title Font Color |
Set the title font color of the widget |
| Title Font Size |
The default title font size is 14px. |
| Display Theme |
Select a theme for chart types |
| Field |
Interpretation |
| Display Y-Axis Title |
Display Y-axis title; enabled by default |
| Y-Axis Title Text |
Title for Y-axis |
| Data Label Display |
Check to display value labels. Default is false |
| Data Label Font Size |
Enter font size, if the display label is set to true. Example: 15px. Defaults to 9px. |
| Data Label Formatter |
For formatting help |
| Data Label Padding |
Set padding around data labels |
| Hover Label Format |
For formatting help |
| Hover Decimal Places |
Number of decimal places to show on the tooltip |
| Field |
Interpretation |
| Show Title |
Show Title on Widget |
| Analyze |
Show Analyze menu |
| Alerts |
Show Alert icon |
| Filters |
Show Filter icon |
| Drilldowns |
Show Drilldowns menu |
| Query |
Show Query menu |
| Data/Export |
Show Data/Export menu |
| Data Diagram |
Show Data Diagram |
| Share |
Show Share menu |
| Refresh |
Show Refresh menu |
| Maximize |
Show Maximize menu |
| Remove from Dashboard |
Show Remove from the Dashboard menu |
Advanced Configuration
| Field |
Interpretation |
| Animation |
Animation of the chart, ON by default |
| Change Dataset |
Change to a different dataset |
| On Click Event Handler |
Define custom javascript behavior when a point is clicked |