Displays hierarchical (tree-structure) data as a set of nested rectangles, with smaller rectangles representing sub-groupings. Each rectangle has an area proportional to a specified dimension of the data. Often the nodes are colored to show a separate dimension of the data.
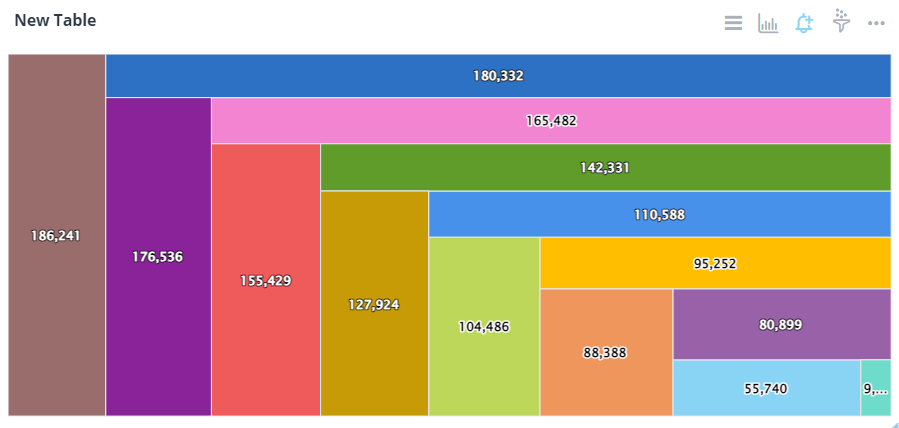
Chart Configuration
| Field |
Interpretation |
| Plot Data/Y-Axis |
Numeric Y-axis field to use. Leave it empty if for multiple Y-axis fields. |
| Y-Axis Categories |
Categories displayed vertically for a grid heatmap |
| Sub Categories |
Sub Categories for each parent category |
| X-Axis Type |
Set to date/time for a time series chart. |
| Field |
Interpretation |
| Title Font Color |
Set the title font color of the widget |
| Title Font Size |
The default title font size is 14px. |
| Display Theme |
Select a theme for chart types |
| Colors |
To set and add color for a chart
|
| Legend Alias |
Change legend display text |
| Background Color |
Change background of widget |
| Field |
Interpretation |
| Y-Axis Label Display |
Hide/show Y-axis labels |
| Data Label Display |
Check to display value labels. Default is false |
| Data Label Font Size |
Enter font size, if the display label is set to true. Example: 15px. Defaults to 9px. |
| Data Label Formatter |
For formatting help |
| Data Label Decimal Places |
Number of decimal places in data label |
| Symbol After Data Label |
Symbol to display after data label |
| Data Label Padding |
Set padding around data labels |
| Data Label Allow Overlap |
To allow data labels to overlap |
| Hover Label Format |
For formatting help |
| Hover Decimal Places |
Number of decimal places to show on tooltip |
| Field |
Interpretation |
| Show Title |
Show Title on Widget |
| Analyze |
Show Analyze menu |
| Alerts |
Show Alert icon |
| Filters |
Show Filter icon |
| Drilldowns |
Show Drilldowns menu |
| Query |
Show Query menu |
| Data/Export |
Show Data/Export menu |
| Data Diagram |
Show Data Diagram |
| Share |
Show Share menu |
| Refresh |
Show Refresh menu |
| Maximize |
Show Maximize menu |
| Remove from Dashboard |
Show Remove from Dashboard menu |
Advanced Configuration
| Field |
Interpretation |
| Animation |
Animation of chart, ON by default |
| Time Series Navigator |
Enable/Disable time series navigator at the bottom of a time series chart; enabled by default |
| Use GPU Translations in Boost Mode |
When in boost mode, GPU translations are faster than regular JS translations |
| Change Dataset |
Change to a different dataset |
| On Click Event Handler |
Define custom javascript behavior when a point is clicked |