Highlights the degree of relationship between two dimensions with color gradients. Examples: Day by Week with Hour-by-Day comparison, Cohort Analysis, etc.
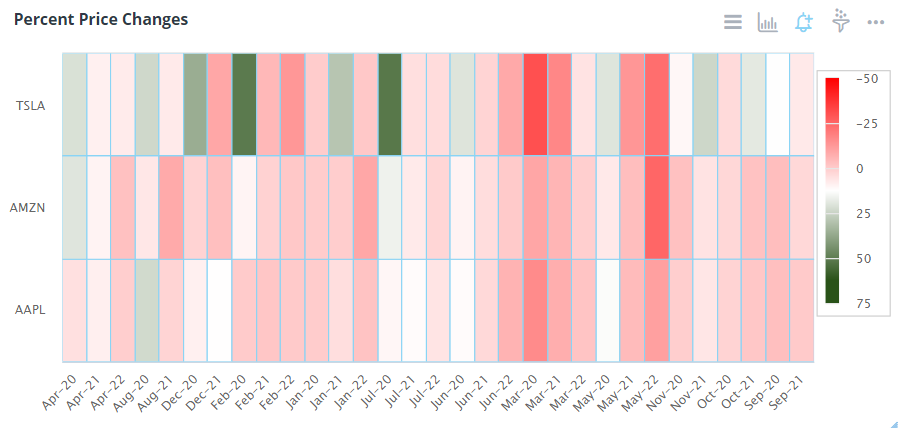
Chart Configuration
| Field |
Interpretation |
| Plot Data/Y-Axis |
Numeric Y-axis field to use. Leave it empty if for multiple Y-axis fields. |
| Y-Axis Categories |
Categories displayed vertically for a grid heatmap |
| X-Axis |
X-axis field if applicable. |
| X-Axis Ordering |
Optional X-axis data ordering if applicable. |
| X-Axis Type |
Set to date/time for a time series chart. |
| Minimum color |
Color name range minimum |
| Middle Color |
Mid range color |
| Max Color |
Color name range maximum |
| Quick Picker X-Axis |
Quickly change value of X-axis from widget top |
| Quick Picker Y-Axis |
Quickly change value of Y-axis from widget top |
| Max Y-Axis Items |
Max number of items to display on Y-axis |
| Max X-Axis Items |
Max number of items to display on X-axis |
| Enable Y-Axis Scroll |
To avoid overcrowding |
| Enable X-axis Scroll |
To avoid overcrowding |
| Baseline Value |
Sets a default lower boundary value for plot data, which may impact the color range scale. |
| Y-Axis Min |
Set the Y-axis minimum values |
| Y-Axis Max |
Optional max Y-axis value. Use it in conjunction with the tick interval to set the Y-axis labels. |
| Y-Axis Logarithmic Scale Axis |
For log scale, enter logarithmic |
| Y-Axis Values in Reverse Order |
Check to reverse the axis so that the highest number is closest to the origin |
| Field |
Interpretation |
| Title Font Color |
Set the title font color of the widget |
| Title Font Size |
The default title font size is 14px. |
| Display Theme |
Select a theme for chart types |
| Legend Show/Hide |
Display legend when enabled |
| Legend font size |
Font size of the legend |
| Reverse Legends |
To reverse the order of the legend items |
| Y-Axis Grid Line width |
Defaults to 1; set to 0 to hide grid lines |
| Field |
Interpretation |
| Display Y-Axis Title |
Display Y-axis title; enabled by default |
| Y-Axis Label Display |
Hide/show Y-axis labels |
| Y-Axis Title Text |
Title for Y-axis |
| X-Axis Title |
Title for X-axis |
| X-Axis Label Display |
Hide/show X-axis labels |
| X-Axis Label Rotation |
Degrees of rotation of X-axis labels; useful for long labels |
| X-Axis Date Formatter |
Override the default X axis date format. Only applicable for chart types with Date/time X axis. See formats here |
| Hover Date Formatter |
Override the default Hover date format. Only applicable for chart types with Date/time X axis. Example: YYYY-MM-DD h:m:s would be displayed as 2021-10-01 01:10:15. See formats here
|
| X-Axis labels format as data units |
Bytes, KB, MB, GB, etc. |
| Data Label Display |
Check to display value labels. Default is false |
| Data Label Font Size |
Enter font size, if the display label is set to true. Example: 15px. Defaults to 9px. |
| Data Label Formatter |
For formatting help |
| Data Label Decimal Places |
Number of decimal places in data label |
| Symbol After Data Label |
Symbol to display after data label |
| Data Label Padding |
Set padding around data labels |
| Data Label Allow Overlap |
To allow data labels to overlap |
| Hover Label Format |
For formatting help |
| Hover Decimal Places |
Number of decimal places to show on tooltip |
| Field |
Interpretation |
| Show Title |
Show Title on Widget |
| Analyze |
Show Analyze menu |
| Alerts |
Show Alert icon |
| Filters |
Show Filter icon |
| Drilldowns |
Show Drilldowns menu |
| Query |
Show Query menu |
| Data/Export |
Show Data/Export menu |
| Data Diagram |
Show Data Diagram |
| Share |
Show Share menu |
| Refresh |
Show Refresh menu |
| Maximize |
Show Maximize menu |
| Remove from Dashboard |
Show Remove from Dashboard menu |
Advanced Configuration
| Field |
Interpretation |
| Animation |
Animation of chart, ON by default |
| Time Series Navigator |
Enable/Disable time series navigator at the bottom of a time series chart; enabled by default |
| Use UTC for Time Series Charts |
Disable auto browser conversion of Timezone for the time series charts and show UTC timestamps |
| Use GPU Translations in Boost Mode |
When in boost mode, GPU translations are faster than regular JS translations |
| Change Dataset |
Change to a different dataset |
| On Click Event Handler |
Define custom javascript behavior when a point is clicked |
Using Runtime tokens
Users can use runtime tokens in charts to dynamically pull data. Runtime tokens are supported in: Widget title, footnote, description, and some fields in the primary and secondary charts. Those fields are: Y-minimum, Y-maximum, Y-axis tick interval, Y-axis title text, X-axis title text, Data Label Formatter, and Hover Label Formatter.
The basic syntax to use a runtime token is \$c9_YourTokenName\$(label)\$
For example:
For a dynamic title: \$c9_myToken\$(Your Title)\$
For integer values: \$c9_myToken\$(500)\$