Useful to represent stages. For example, a sales funnel that tracks pipeline data from a number of leads to closed won.
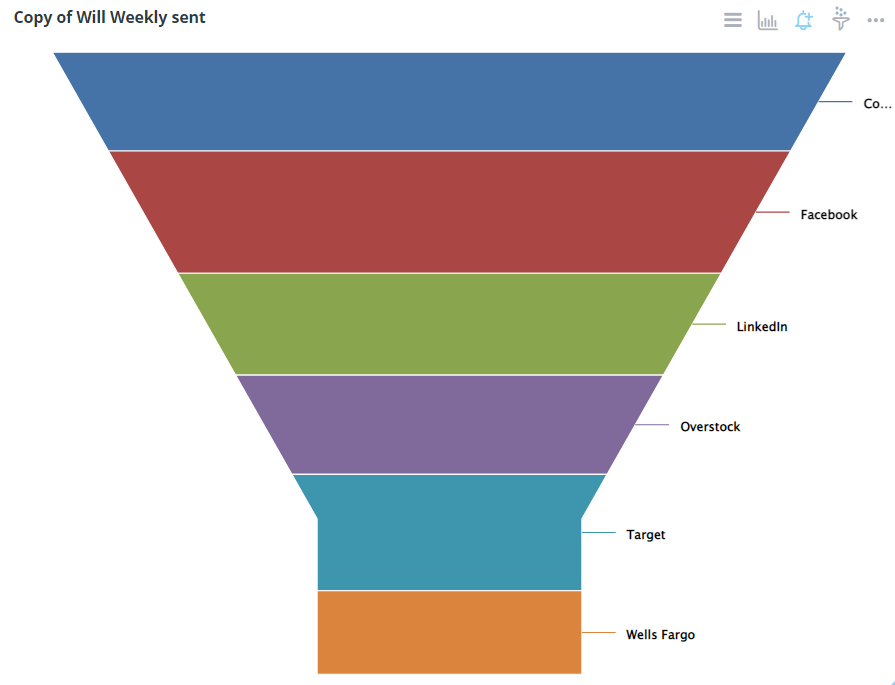
Chart Configuration
| Field |
Interpretation |
| Plot Data/Y-Axis |
Numeric Y-axis field to use. Leave it empty if for multiple Y-axis fields. |
| Grouping/Legend |
Legend/series field if a column contains the fields. |
| Field |
Interpretation |
| Title Font Color |
Set the title font color of the widget |
| Title Font Size |
The default title font size is 14px. |
| Display Theme |
Select a theme for chart types |
| Colors |
To set and add color to a chart
|
| Legend Alias |
Change legend display text |
| Background Color |
Change the background of the widget |
| Field |
Interpretation |
| Data Label Decimal Places |
Number of decimal places in the data label |
| Symbol After Data Label |
Symbol to display after data label |
| Data Labels X Offset |
The X position offset of the label relative to the point in pixels |
| Data Labels Y Offset |
The Y position offset of the label relative to the point in pixels |
| Field |
Interpretation |
| Show Title |
Show Title on Widget |
| Analyze |
Show Analyze menu |
| Alerts |
Show Alert icon |
| Filters |
Show Filter icon |
| Drilldowns |
Show Drilldowns menu |
| Query |
Show Query menu |
| Data/Export |
Show Data/Export menu |
| Data Diagram |
Show Data Diagram |
| Share |
Show Share menu |
| Refresh |
Show Refresh menu |
| Maximize |
Show Maximize menu |
| Remove from Dashboard |
Show Remove from the Dashboard menu |
Advanced Configuration
| Field |
Interpretation |
| Change Dataset |
Change to a different dataset |
| On Click Event Handler |
Define custom javascript behavior when a point is clicked |