Variation of a line chart with curve fitting.
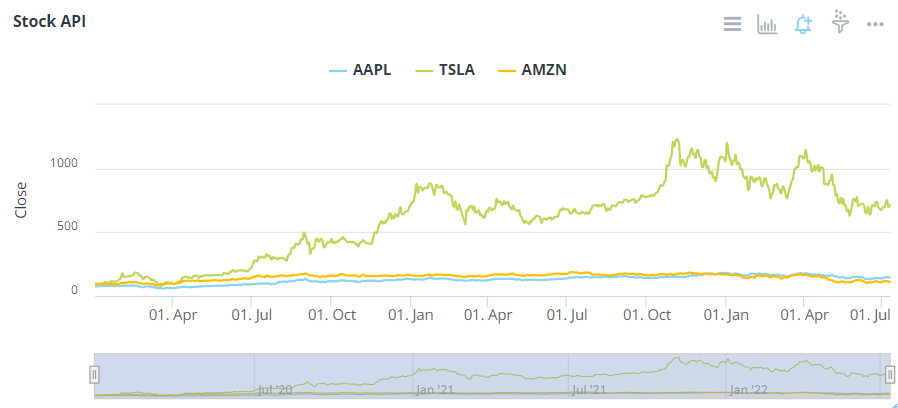
Chart Configuration
| Field |
Interpretation |
| Plot Data/Y-Axis |
Numeric Y-axis field to use. Leave it empty if for multiple Y-axis fields. |
| Grouping/Legend |
Legend/series field if a column contains the fields. |
| X-Axis |
X-axis field if applicable. |
| X-Axis Ordering |
Optional X-axis data ordering if applicable. |
| X-Axis Type |
Set to date/time for a time series chart. |
| Y-Axis Max |
Optional max Y-axis value. Use it in conjunction with the tick interval to set the Y-axis labels. |
| Y-Axis Tick Interval |
Optional Y-axis tick interval to set the Y-axis labels. |
| Y-Axis Min |
Set the Y-axis minimum values |
| Y-Axis Logarithmic Scale Axis |
For log scale, enter logarithmic |
| Y-Axis Values in Reverse Order |
Check to reverse the axis so that the highest number is closest to the origin |
| Field |
Interpretation |
| Title Font Color |
Set the title font color of the widget |
| Title Font Size |
The default title font size is 14px. |
| Display Theme |
Select a theme for chart types |
| Primary Chart Opacity |
Set chart opacity. Defaults to 100 (0=transparent, 100=opaque) |
| Colors |
To set and add color for a chart |
| Legend Alias |
Change legend display text |
| Background Color |
Change background of widget |
| Legend Ordering |
Legend ordering method, if applicable. |
| Legend Show/Hide |
Display legend when enabled |
| Legend font size |
Font size of the legend |
| Reverse Legends |
To reverse the order of the legend items |
| Y-Axis Grid Line width |
Defaults to 1; set to 0 to hide grid lines |
| Field |
Interpretation |
| Label |
Display label for the target line in the legend of the chart. |
| Value |
You can either input a static number, select a column to use the value from its first row, or reference a variable. |
| Color |
Color of the target line. |
| Weight / Thickness |
Thickness of the target line. |
| Line Style |
Line style of the target line. |
Widget Labels
| Field |
Interpretation |
| Display Y-Axis Title |
Display Y-axis title; enabled by default |
| Y-Axis Label Display |
Hide/show Y-axis labels |
| Y-Axis Title Text |
Title for Y-axis |
| X-Axis Title |
Title for X-axis |
| X-Axis Label Display |
Hide/show X-axis labels |
| X-Axis Label Rotation |
Degrees of rotation of X-axis labels; useful for long labels |
| X-Axis Date Formatter |
Override the default X axis date format. Only applicable for chart types with Date/time X axis. See formats here |
| X-Axis labels format as data units |
Bytes, KB, MB, GB, etc. |
| Data Label Display |
Check to display value labels. Default is false |
| Data Label Font Size |
Enter font size, if the display label is set to true. Example: 15px. Defaults to 9px. |
| Data Label Formatter |
For formatting help |
| Y-Axis Labels Formatter |
For formatting help |
| Data Label Decimal Places |
Number of decimal places in data label |
| Symbol After Data Label |
Symbol to display after data label |
| Data Label Padding |
Set padding around data labels |
| Data Label Allow Overlap |
To allow data labels to overlap |
| Data Labels X Offset |
The X position offset of the label relative to the point in pixels |
| Hover Label Format |
For formatting help |
| Data Labels Y Offset |
The Y position offset of the label relative to the point in pixels |
| Hover Decimal Places |
Number of decimal places to show on tooltip |
Secondary Chart Configuration
| Field |
Interpretation |
| Secondary Y-Axis |
Optional secondary Y-axis on the right-hand side of the chart. |
| Secondary chart type |
Chart type for the secondary chart |
| Secondary chart grouping |
Display a second stacking groups on the X-axis based on the string field selected |
| Synchronize Y-axis Ticks |
Align primary and secondary chart axis tick marks |
| Secondary Chart Send to Back |
Adjusts (z-index) to send the secondary chart behind the first. |
| Synchronize Y-Axis values |
Synchronizes the Y-axis primary and secondary to the same values. |
| Secondary Y-Axis Max |
Set the Y-axis max values for the secondary Y-axis. x-axis fields |
| Secondary Y-Axis Logarithmic Axis |
For log scale, enter logarithmic |
| Secondary Y-Axis Min |
Set the Y-axis min values for the secondary Y-axis |
Secondary Chart Display
| Field |
Interpretation |
| Secondary Chart Opacity |
Set secondary chart opacity. 0=transparent, 100=opaque |
| Secondary Y-Axis Title Display |
Display secondary Y-axis; enabled by default |
| Secondary Data Label Display |
Display secondary value labels; default is false |
| Secondary Y-Axis Title Text |
Title for secondary Y-axis |
| Secondary Data Label Formatter |
For formatting; click here
|
| Secondary Y-Axis Labels Formatter |
For formatting; click here
|
| Secondary Y-Axis Symbol Before Data Label |
Symbol to display before data label for secondary Y-axis |
| Secondary Y-Axis Symbol After Data Label |
Symbol to display after data label for secondary Y-axis |
| Secondary Data Label Decimal Places |
Number of decimal places in data label for secondary Y-axis |
| Secondary Data Labels X Offset |
The X position offset of the label relative to the point in pixels |
| Secondary Y-Axis Value in Reverse Order |
Click to reverse the axis so that the highest number is closest to the origin |
| Secondary Data Labels Y Offset |
The Y position offset of the label relative to the point in pixels |
| Secondary Hover Label Format |
Helps users format secondary chart display data. For formatting help, click here
|
| Field |
Interpretation |
| Show Title |
Show Title on Widget |
| Analyze |
Show Analyze menu |
| Alerts |
Show Alert icon |
| Filters |
Show Filter icon |
| Drilldowns |
Show Drilldowns menu |
| Query |
Show Query menu |
| Data/Export |
Show Data/Export menu |
| Data Diagram |
Show Data Diagram |
| Share |
Show Share menu |
| Refresh |
Show Refresh menu |
| Maximize |
Show Maximize menu |
| Remove from Dashboard |
Show Remove from Dashboard menu |
Advanced Configuration
| Field |
Interpretation |
| Animation |
Animation of chart, ON by default |
| Time Series Navigator |
Enable/Disable time series navigator at the bottom of a time series chart; enabled by default |
| Polar |
To transform cartesian charts like line, spline, area and column into the polar coordinate system |
| Use UTC for Time Series Charts |
Disable auto browser conversion of Timezone for the time series charts and show UTC timestamps |
| X-Axis Ordinal |
Points are equally spaced in the chart regardless of the actual time or x distance between them |
| Change Dataset |
Change to a different dataset |
| On Click Event Handler |
Define custom javascript behavior when a point is clicked |