Variation of a pie chart.
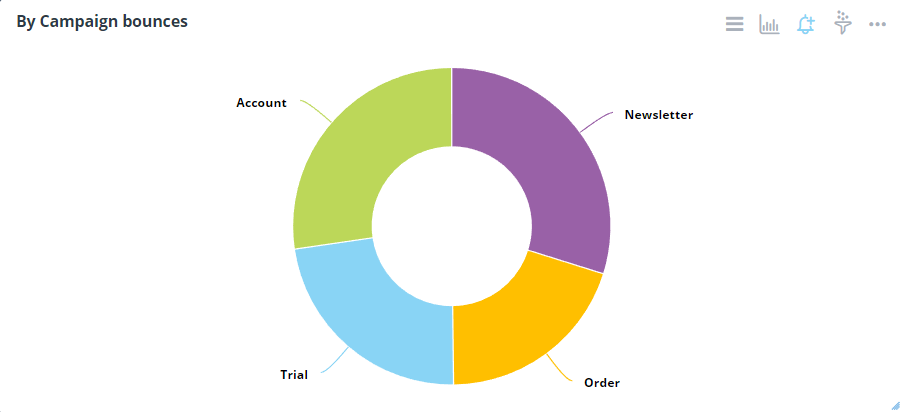
Chart Configuration
| Field |
Interpretation |
| Plot Data/Y-Axis |
Numeric Y-axis field to use. Leave it empty if for multiple Y-axis fields. |
| Grouping/Legend |
Legend/series field if a column contains the fields. |
| Field |
Interpretation |
| Title Font Color |
Set the title font color of the widget |
| Title Font Size |
The default title font size is 14px. |
| Display Theme |
Select a theme for chart types |
| Colors |
To set and add color to a chart |
| Legend Alias |
Change legend display text |
| Background Color |
Change the background of the widget |
| Legend Ordering |
Legend ordering method, if applicable. |
| Display "Total" |
To show total |
| Legend Show/Hide |
Display legend when enabled |
| Field |
Interpretation |
| Label - Display as Percent |
Convert display label values to percentage |
| Label - Display value |
Display the series name and associated values |
| Data Label Display |
Check to display value labels. Default is false |
| Data Label Font Size |
Enter font size if the display label is set to true. Example: 15px. Defaults to 9px. |
| Data Label Formatter |
For formatting help |
| Data Label Decimal Places |
Number of decimal places in the data label |
| Data Label Padding |
Set padding around data labels |
| Data Label Allow Overlap |
To allow data labels to overlap |
| Hover Label Format |
For formatting help |
| Hover Decimal Places |
Number of decimal places to show on the tooltip |
| Field |
Interpretation |
| Show Title |
Show Title on Widget |
| Analyze |
Show Analyze menu |
| Alerts |
Show Alert icon |
| Filters |
Show Filter icon |
| Drilldowns |
Show Drilldowns menu |
| Query |
Show Query menu |
| Data/Export |
Show Data/Export menu |
| Data Diagram |
Show Data Diagram |
| Share |
Show Share menu |
| Refresh |
Show Refresh menu |
| Maximize |
Show Maximize menu |
| Remove from Dashboard |
Show Remove from the Dashboard menu |
Advanced Configuration
| Field |
Interpretation |
| Animation |
Animation of the chart, ON by default |
| Change Dataset |
Change to a different dataset |
| On Click Event Handler |
Define custom javascript behavior when a point is clicked |